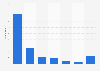
There were 1,085 firearm offences recorded in London 2022/23, compared with 1,071 in 2021/22, which was the year with the fewest firearm offences in the provided time period. Compared with previous years, there were far fewer offences in 2020/21 and 2021/22, which may have been due to the lockdowns brought about by the COVID-19 pandemic. This is also reflected in London's overall crime rate, which fell from 102.4 crimes per 1,000 people in 2019/20, to 83.3 in 2020/21, before increasing to 92.8 in 2021/22, and 105.8 in the most recent reporting year.
Firearm homicides rare in the UK
The United Kingdom has some of the strictest gun laws in the world, resulting in relatively low levels of gun crime and firearm homicides. In 2022/23 just 4.9 percent of homicides in England and Wales were the result of shootings, compared with 85.7 percent in the United States in 2021. The most common method of killing for homicides in England and Wales was by far the use of a sharp instrument at 41.4 percent of homicides in the 2022/23 reporting year.
London police budget rising
In 2023/24 the budget for policing in London reached 4.53 billion British pounds, compared with 4.44 billion pounds in the previous financial year. This is the sixth-consecutive year of London's police budget increasing, compared with the period between 2013/14 and 2018/19, when it remained around 3.3 billion pounds, and was actually smaller than in 2012/13 when the budget was 3.62 billion. These budget increases have occurred alongside a recruitment drive for police officers. In 2023, there were 35,900 police officers in London, compared with just 31,087 in 2018.
Number of firearm offences (excluding air weapons) in London from 2015/16 to 2022/23
(in 1,000s)
Profit from the additional features of your individual account
Currently, you are using a shared account. To use individual functions (e.g., mark statistics as favourites, set
statistic alerts) please log in with your personal account.
If you are an admin, please authenticate by logging in again.
Learn more about how Statista can support your business.
Office for National Statistics (UK). (November 16, 2023). Number of firearm offences (excluding air weapons) in London from 2015/16 to 2022/23 (in 1,000s) [Graph]. In Statista. Retrieved September 20, 2024, from https://www-statista-com.ezproxy.canberra.edu.au/statistics/865565/gun-crime-in-london/
Office for National Statistics (UK). "Number of firearm offences (excluding air weapons) in London from 2015/16 to 2022/23 (in 1,000s)." Chart. November 16, 2023. Statista. Accessed September 20, 2024. https://www-statista-com.ezproxy.canberra.edu.au/statistics/865565/gun-crime-in-london/
Office for National Statistics (UK). (2023). Number of firearm offences (excluding air weapons) in London from 2015/16 to 2022/23 (in 1,000s). Statista. Statista Inc.. Accessed: September 20, 2024. https://www-statista-com.ezproxy.canberra.edu.au/statistics/865565/gun-crime-in-london/
Office for National Statistics (UK). "Number of Firearm Offences (excluding Air Weapons) in London from 2015/16 to 2022/23 (in 1,000s)." Statista, Statista Inc., 16 Nov 2023, https://www-statista-com.ezproxy.canberra.edu.au/statistics/865565/gun-crime-in-london/
Office for National Statistics (UK), Number of firearm offences (excluding air weapons) in London from 2015/16 to 2022/23 (in 1,000s) Statista, https://www-statista-com.ezproxy.canberra.edu.au/statistics/865565/gun-crime-in-london/ (last visited September 20, 2024)
Number of firearm offences (excluding air weapons) in London from 2015/16 to 2022/23 (in 1,000s) [Graph], Office for National Statistics (UK), November 16, 2023. [Online]. Available: https://www-statista-com.ezproxy.canberra.edu.au/statistics/865565/gun-crime-in-london/