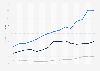
Comparing the 15 selected regions regarding the average volume per capita in the 'Athletic Footwear' segment of the footwear market, the United States is leading the ranking (0.33 pairs) and is followed by the United Kingdom with 0.26 pairs. At the other end of the spectrum is India with 0.01 pairs, indicating a difference of 0.32 pairs to the United States.
Data provided by Statista Market Insights are estimates.
Definition:
The Athletic Footwear segment includes shoes specifically designed for sports purposes (e.g., soccer, tennis, basketball, etc.). The definition is based on the Harmonized System of international trade (specifically the HS codes 640219 and 640319) which include only functional sports shoes and excludes snow-ski footwear as well as skating boots. Most so-called 'athleisure' footwear or sneakers, i.e. everyday footwear with an athletic appearance, are excluded from this definition and can be found in the Sneakers segment.
Additional Information:
The market comprises revenue and average revenue per capita, volume and average volume per capita, price per unit (per pair), sustainable footwear share, and sales channels data. The online distribution channel refers to the purchase of physical goods from a digital marketplace. In other words, the purchase is conducted via the internet, be it on a desktop PC, tablet, or smartphone. The offline distribution channel covers all purchases in stationary stores, by telesales, or via mail order (e.g., print catalogs).
Profit from the additional features of your individual account
Currently, you are using a shared account. To use individual functions (e.g., mark statistics as favourites, set
statistic alerts) please log in with your personal account.
If you are an admin, please authenticate by logging in again.
Learn more about how Statista can support your business.
Statista. (August 25, 2023). Per-capita volume sales in the athletic footwear market worldwide, by country in 2023 (in pieces) [Graph]. In Statista. Retrieved September 20, 2024, from https://www-statista-com.ezproxy.canberra.edu.au/forecasts/758743/per-capita-volume-sales-in-the-athletic-footwear-market-worldwide-by-country
Statista. "Per-capita volume sales in the athletic footwear market worldwide, by country in 2023 (in pieces)." Chart. August 25, 2023. Statista. Accessed September 20, 2024. https://www-statista-com.ezproxy.canberra.edu.au/forecasts/758743/per-capita-volume-sales-in-the-athletic-footwear-market-worldwide-by-country
Statista. (2023). Per-capita volume sales in the athletic footwear market worldwide, by country in 2023 (in pieces). Statista. Statista Inc.. Accessed: September 20, 2024. https://www-statista-com.ezproxy.canberra.edu.au/forecasts/758743/per-capita-volume-sales-in-the-athletic-footwear-market-worldwide-by-country
Statista. "Per-capita Volume Sales in The Athletic Footwear Market Worldwide, by Country in 2023 (in Pieces)." Statista, Statista Inc., 25 Aug 2023, https://www-statista-com.ezproxy.canberra.edu.au/forecasts/758743/per-capita-volume-sales-in-the-athletic-footwear-market-worldwide-by-country
Statista, Per-capita volume sales in the athletic footwear market worldwide, by country in 2023 (in pieces) Statista, https://www-statista-com.ezproxy.canberra.edu.au/forecasts/758743/per-capita-volume-sales-in-the-athletic-footwear-market-worldwide-by-country (last visited September 20, 2024)
Per-capita volume sales in the athletic footwear market worldwide, by country in 2023 (in pieces) [Graph], Statista, August 25, 2023. [Online]. Available: https://www-statista-com.ezproxy.canberra.edu.au/forecasts/758743/per-capita-volume-sales-in-the-athletic-footwear-market-worldwide-by-country