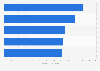
Continental saw revenues come to around 41.4 billion euros in its 2023 fiscal year, an increase of roughly five percent compared with the previous year. Europe, where Continental mainly operates, is the most profitable market for the company.
Acquisitions and research drive revenue growth
The German automotive supplier has taken over many other companies in the automotive sector, including Siemens VDO, Emitec, and Veyance. In 2019, Continental separated its Powertrain division into its own legal entity, which also incurred expenses. The company's diversification and consolidation strategy has contributed to large current operations. Additionally, the company has among the highest R&D intensities in the world.
Summary of operations
In 1871, Continental began as a manufacturer of rubber fabrics and products in Hanover. The company developed pneumatic tires before providing other automotive parts such as interior, powertrains, and chassis. Hanover remains the center of operations, and Germany provides one in four workers for the company. Continental’s operations are split into two groups: the rubber group, responsible for pneumatic tires and conveyor belts, and the automotive group, responsible for brakes, connectivity, and engines. Both segments have been growing at similar rates. In 2014 and 2015, these two groups saw significant acquisitions, expanding Continental’s operations. Ford, BMW, Daimler, VW, and GM are among Continental's key customers.
Continental AG's revenue from FY 1999 to FY 2023
(in billion euros)
Data prior to 2022 were taken from previous annual reports. Data from 1999 to 2003 has been reported according to U.S. GAAP standards. Data from all fiscal years since 2004 has been reported according to IFRS standards.
Profit from the additional features of your individual account
Currently, you are using a shared account. To use individual functions (e.g., mark statistics as favourites, set
statistic alerts) please log in with your personal account.
If you are an admin, please authenticate by logging in again.
Learn more about how Statista can support your business.
Continental AG. (February 27, 2024). Continental AG's revenue from FY 1999 to FY 2023 (in billion euros) [Graph]. In Statista. Retrieved September 19, 2024, from https://www-statista-com.ezproxy.canberra.edu.au/statistics/264242/revenue-of-continental-ag-since-1999/
Continental AG. "Continental AG's revenue from FY 1999 to FY 2023 (in billion euros)." Chart. February 27, 2024. Statista. Accessed September 19, 2024. https://www-statista-com.ezproxy.canberra.edu.au/statistics/264242/revenue-of-continental-ag-since-1999/
Continental AG. (2024). Continental AG's revenue from FY 1999 to FY 2023 (in billion euros). Statista. Statista Inc.. Accessed: September 19, 2024. https://www-statista-com.ezproxy.canberra.edu.au/statistics/264242/revenue-of-continental-ag-since-1999/
Continental AG. "Continental Ag's Revenue from Fy 1999 to Fy 2023 (in Billion Euros)." Statista, Statista Inc., 27 Feb 2024, https://www-statista-com.ezproxy.canberra.edu.au/statistics/264242/revenue-of-continental-ag-since-1999/
Continental AG, Continental AG's revenue from FY 1999 to FY 2023 (in billion euros) Statista, https://www-statista-com.ezproxy.canberra.edu.au/statistics/264242/revenue-of-continental-ag-since-1999/ (last visited September 19, 2024)
Continental AG's revenue from FY 1999 to FY 2023 (in billion euros) [Graph], Continental AG, February 27, 2024. [Online]. Available: https://www-statista-com.ezproxy.canberra.edu.au/statistics/264242/revenue-of-continental-ag-since-1999/