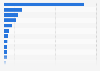
The graph depicts the monthly time spent watching selected online streaming services per household in the United States as of April 2017. According to the source, households with Netflix spent an average of 27 hours monthly using the service as of April 2017.
Monthly time spent watching selected online streaming services per household in the United States as of April 2017
(in hours)
Profit from the additional features of your individual account
Currently, you are using a shared account. To use individual functions (e.g., mark statistics as favourites, set
statistic alerts) please log in with your personal account.
If you are an admin, please authenticate by logging in again.
Learn more about how Statista can support your business.
Statista. (July 7, 2017). Monthly time spent watching selected online streaming services per household in the United States as of April 2017 (in hours) [Graph]. In Statista. Retrieved September 19, 2024, from https://www-statista-com.ezproxy.canberra.edu.au/statistics/223222/monthly-video-use-in-the-us/
Statista. "Monthly time spent watching selected online streaming services per household in the United States as of April 2017 (in hours)." Chart. July 7, 2017. Statista. Accessed September 19, 2024. https://www-statista-com.ezproxy.canberra.edu.au/statistics/223222/monthly-video-use-in-the-us/
Statista. (2017). Monthly time spent watching selected online streaming services per household in the United States as of April 2017 (in hours). Statista. Statista Inc.. Accessed: September 19, 2024. https://www-statista-com.ezproxy.canberra.edu.au/statistics/223222/monthly-video-use-in-the-us/
Statista. "Monthly Time Spent Watching Selected Online Streaming Services per Household in The United States as of April 2017 (in Hours)." Statista, Statista Inc., 7 Jul 2017, https://www-statista-com.ezproxy.canberra.edu.au/statistics/223222/monthly-video-use-in-the-us/
Statista, Monthly time spent watching selected online streaming services per household in the United States as of April 2017 (in hours) Statista, https://www-statista-com.ezproxy.canberra.edu.au/statistics/223222/monthly-video-use-in-the-us/ (last visited September 19, 2024)
Monthly time spent watching selected online streaming services per household in the United States as of April 2017 (in hours) [Graph], Statista, July 7, 2017. [Online]. Available: https://www-statista-com.ezproxy.canberra.edu.au/statistics/223222/monthly-video-use-in-the-us/