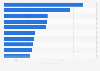
Cover Corporation generated net sales of more than 30 billion Japanese yen in fiscal year 2023, which was an increase of almost 10 billion yen over the previous year. The company operates the virtual YouTuber (VTuber) agency Hololive Production and also engages in media mix and metaverse businesses.
Net sales of Cover Corporation from fiscal year 2018 to 2023
(in billion Japanese yen)
fiscal year 2018 to 2023; the company's fiscal year starts on April 1 of the stated year and ends on March 31 of the following year
Supplementary notes
100 Japanese yen equal 0.62 U.S. dollars or 0.58 euros as of July 2024. Values have been rounded. Data prior to fiscal year 2019 come from previous reporting.
Profit from the additional features of your individual account
Currently, you are using a shared account. To use individual functions (e.g., mark statistics as favourites, set
statistic alerts) please log in with your personal account.
If you are an admin, please authenticate by logging in again.
Learn more about how Statista can support your business.
Cover. (July 1, 2024). Net sales of Cover Corporation from fiscal year 2018 to 2023 (in billion Japanese yen) [Graph]. In Statista. Retrieved September 19, 2024, from https://www-statista-com.ezproxy.canberra.edu.au/statistics/1446561/cover-revenue/
Cover. "Net sales of Cover Corporation from fiscal year 2018 to 2023 (in billion Japanese yen)." Chart. July 1, 2024. Statista. Accessed September 19, 2024. https://www-statista-com.ezproxy.canberra.edu.au/statistics/1446561/cover-revenue/
Cover. (2024). Net sales of Cover Corporation from fiscal year 2018 to 2023 (in billion Japanese yen). Statista. Statista Inc.. Accessed: September 19, 2024. https://www-statista-com.ezproxy.canberra.edu.au/statistics/1446561/cover-revenue/
Cover. "Net Sales of Cover Corporation from Fiscal Year 2018 to 2023 (in Billion Japanese Yen)." Statista, Statista Inc., 1 Jul 2024, https://www-statista-com.ezproxy.canberra.edu.au/statistics/1446561/cover-revenue/
Cover, Net sales of Cover Corporation from fiscal year 2018 to 2023 (in billion Japanese yen) Statista, https://www-statista-com.ezproxy.canberra.edu.au/statistics/1446561/cover-revenue/ (last visited September 19, 2024)
Net sales of Cover Corporation from fiscal year 2018 to 2023 (in billion Japanese yen) [Graph], Cover, July 1, 2024. [Online]. Available: https://www-statista-com.ezproxy.canberra.edu.au/statistics/1446561/cover-revenue/