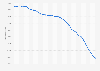
In May 2021, the average revenue per paying user with carrier billing in South Korea amounted to 6.8 U.S. dollars. Carrier billing is a popular method to pay for digital purchases via mobile, especially content such as mobile games and in-game content.
Average revenue per paying user with carrier billing in South Korea from May 2020 to May 2021
(in U.S. dollars)
Profit from the additional features of your individual account
Currently, you are using a shared account. To use individual functions (e.g., mark statistics as favourites, set
statistic alerts) please log in with your personal account.
If you are an admin, please authenticate by logging in again.
Learn more about how Statista can support your business.
Fortumo. (June 20, 2021). Average revenue per paying user with carrier billing in South Korea from May 2020 to May 2021 (in U.S. dollars) [Graph]. In Statista. Retrieved September 20, 2024, from https://www-statista-com.ezproxy.canberra.edu.au/statistics/1122539/south-korea-average-revenue-per-user-with-carrier-billing/
Fortumo. "Average revenue per paying user with carrier billing in South Korea from May 2020 to May 2021 (in U.S. dollars)." Chart. June 20, 2021. Statista. Accessed September 20, 2024. https://www-statista-com.ezproxy.canberra.edu.au/statistics/1122539/south-korea-average-revenue-per-user-with-carrier-billing/
Fortumo. (2021). Average revenue per paying user with carrier billing in South Korea from May 2020 to May 2021 (in U.S. dollars). Statista. Statista Inc.. Accessed: September 20, 2024. https://www-statista-com.ezproxy.canberra.edu.au/statistics/1122539/south-korea-average-revenue-per-user-with-carrier-billing/
Fortumo. "Average Revenue per Paying User with Carrier Billing in South Korea from May 2020 to May 2021 (in U.S. Dollars)." Statista, Statista Inc., 20 Jun 2021, https://www-statista-com.ezproxy.canberra.edu.au/statistics/1122539/south-korea-average-revenue-per-user-with-carrier-billing/
Fortumo, Average revenue per paying user with carrier billing in South Korea from May 2020 to May 2021 (in U.S. dollars) Statista, https://www-statista-com.ezproxy.canberra.edu.au/statistics/1122539/south-korea-average-revenue-per-user-with-carrier-billing/ (last visited September 20, 2024)
Average revenue per paying user with carrier billing in South Korea from May 2020 to May 2021 (in U.S. dollars) [Graph], Fortumo, June 20, 2021. [Online]. Available: https://www-statista-com.ezproxy.canberra.edu.au/statistics/1122539/south-korea-average-revenue-per-user-with-carrier-billing/