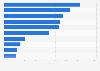
Regeneron Pharmaceuticals' net income per basic share in 2023 was recorded at 37.05 U.S. dollars, compared to some 40.5 U.S. dollars in the year before. Regeneron is a U.S-based global biotech company with headquarters in Tarrytown, New York.
Net income per share of Regeneron Pharmaceuticals from 2016 to 2023
(in U.S. dollars)
Profit from the additional features of your individual account
Currently, you are using a shared account. To use individual functions (e.g., mark statistics as favourites, set
statistic alerts) please log in with your personal account.
If you are an admin, please authenticate by logging in again.
Learn more about how Statista can support your business.
Regeneron. (February 5, 2024). Net income per share of Regeneron Pharmaceuticals from 2016 to 2023 (in U.S. dollars) [Graph]. In Statista. Retrieved September 20, 2024, from https://www-statista-com.ezproxy.canberra.edu.au/statistics/1102013/regeneron-pharmaceuticals-net-income-per-share/
Regeneron. "Net income per share of Regeneron Pharmaceuticals from 2016 to 2023 (in U.S. dollars)." Chart. February 5, 2024. Statista. Accessed September 20, 2024. https://www-statista-com.ezproxy.canberra.edu.au/statistics/1102013/regeneron-pharmaceuticals-net-income-per-share/
Regeneron. (2024). Net income per share of Regeneron Pharmaceuticals from 2016 to 2023 (in U.S. dollars). Statista. Statista Inc.. Accessed: September 20, 2024. https://www-statista-com.ezproxy.canberra.edu.au/statistics/1102013/regeneron-pharmaceuticals-net-income-per-share/
Regeneron. "Net Income per Share of Regeneron Pharmaceuticals from 2016 to 2023 (in U.S. Dollars)." Statista, Statista Inc., 5 Feb 2024, https://www-statista-com.ezproxy.canberra.edu.au/statistics/1102013/regeneron-pharmaceuticals-net-income-per-share/
Regeneron, Net income per share of Regeneron Pharmaceuticals from 2016 to 2023 (in U.S. dollars) Statista, https://www-statista-com.ezproxy.canberra.edu.au/statistics/1102013/regeneron-pharmaceuticals-net-income-per-share/ (last visited September 20, 2024)
Net income per share of Regeneron Pharmaceuticals from 2016 to 2023 (in U.S. dollars) [Graph], Regeneron, February 5, 2024. [Online]. Available: https://www-statista-com.ezproxy.canberra.edu.au/statistics/1102013/regeneron-pharmaceuticals-net-income-per-share/