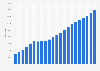
Significant fluctuations are estimated for all segments over the forecast period for the revenue per capita, combined. In general, the indicator appears to exhibit a positive trend, with more segments showing increasing values rather than decreasing values until 2029. Among them, the segment Coffee attains the highest value throughout the entire period, reaching 830.68 U.S. dollars.
Data provided by Statista Market Insights are estimates.
Definition:
The Hot Drinks market includes the Coffee, Tea, and Cocoa market. In the Hot Drinks market, products in dry form (such as powders, beans, and leaves) are covered. The drink is prepared by adding liquids, such as hot water or milk, to the product. Ready-to-Drink (RTD) Coffee and Tea products in liquid form are in the corresponding segment in the Non-Alcoholic Drinks market.
Structure:
The Hot Drinks market is divided into the Coffee market, the Tea market, and the Cocoa market.
The Coffee market consists of Roast Coffee in the form of ground coffee and whole beans, that is prepared with coffee machines or a French press, as well as Instant Coffee that only requires the addition of hot water.
The Tea market consists of black tea, green tea, and mate sold in tea bags or as loose-leaf tea.
The Cocoa market contains powder and powder-mixes for the preparation of cocoa drinks or hot chocolate.
Additional information:
The market comprises revenue and average revenue per capita, volume and average volume per capita, price per kilogram , as well as sales channels. Per capita figures refer to a country’s or region’s whole population.
At-home market data covers retail sales via super- and hypermarkets, eCommerce, convenience stores, and similar sales channels. Out-of-home market data includes all sales in hotels and restaurants, sales by catering companies, as well as sales in cafés, bars, and similar hospitality service establishments. In the out-of-home market, the price always refers to the price per kilogram of the beverage consumed, regardless of other components in the finished beverage. Combined numbers encompass both the at-home market and the out-of-home market. All prices are valued at retail selling prices, including all sales and consumption taxes.
Key players include Nestlé (e.g., Nescafé and Nespresso), Tchibo, Starbucks, Lavazza, and Tata Global Beverages (Tetley).
Profit from the additional features of your individual account
Currently, you are using a shared account. To use individual functions (e.g., mark statistics as favourites, set
statistic alerts) please log in with your personal account.
If you are an admin, please authenticate by logging in again.
Learn more about how Statista can support your business.
Statista Market Insights. (June 27, 2024). Average revenue per unit (ARPU) in the Hot Drinks market for different segments Sweden from 2019 to 2029 [Graph]. In Statista. Retrieved September 21, 2024, from https://www-statista-com.ezproxy.canberra.edu.au/forecasts/1443983/average-revenue-per-unit-arpu-hot-drinks-market-for-different-segments-sweden
Statista Market Insights. "Average revenue per unit (ARPU) in the Hot Drinks market for different segments Sweden from 2019 to 2029." Chart. June 27, 2024. Statista. Accessed September 21, 2024. https://www-statista-com.ezproxy.canberra.edu.au/forecasts/1443983/average-revenue-per-unit-arpu-hot-drinks-market-for-different-segments-sweden
Statista Market Insights. (2024). Average revenue per unit (ARPU) in the Hot Drinks market for different segments Sweden from 2019 to 2029. Statista. Statista Inc.. Accessed: September 21, 2024. https://www-statista-com.ezproxy.canberra.edu.au/forecasts/1443983/average-revenue-per-unit-arpu-hot-drinks-market-for-different-segments-sweden
Statista Market Insights. "Average Revenue per Unit (Arpu) in The Hot Drinks Market for Different Segments Sweden from 2019 to 2029." Statista, Statista Inc., 27 Jun 2024, https://www-statista-com.ezproxy.canberra.edu.au/forecasts/1443983/average-revenue-per-unit-arpu-hot-drinks-market-for-different-segments-sweden
Statista Market Insights, Average revenue per unit (ARPU) in the Hot Drinks market for different segments Sweden from 2019 to 2029 Statista, https://www-statista-com.ezproxy.canberra.edu.au/forecasts/1443983/average-revenue-per-unit-arpu-hot-drinks-market-for-different-segments-sweden (last visited September 21, 2024)
Average revenue per unit (ARPU) in the Hot Drinks market for different segments Sweden from 2019 to 2029 [Graph], Statista Market Insights, June 27, 2024. [Online]. Available: https://www-statista-com.ezproxy.canberra.edu.au/forecasts/1443983/average-revenue-per-unit-arpu-hot-drinks-market-for-different-segments-sweden