Over the next few days, thousands of video game industry insiders and gaming enthusiasts will flock to the Los Angeles Convention Center for this year’s Electronic Entertainment Expo (E3). Hosted by the Entertainment Software Association (ESA), the annual trade show is the world’s largest event for computer and video games where many of the largest players in the industry choose to show off their latest products.
While many people still shrug off video games as child’s play, that couldn’t be further from the truth. According to ESA, the average male video game player in the U.S. is 32 years old and the average female player is even older at 34. And it’s not just that: video games are a billion-dollar industry supporting more than 200,000 jobs in the United States.
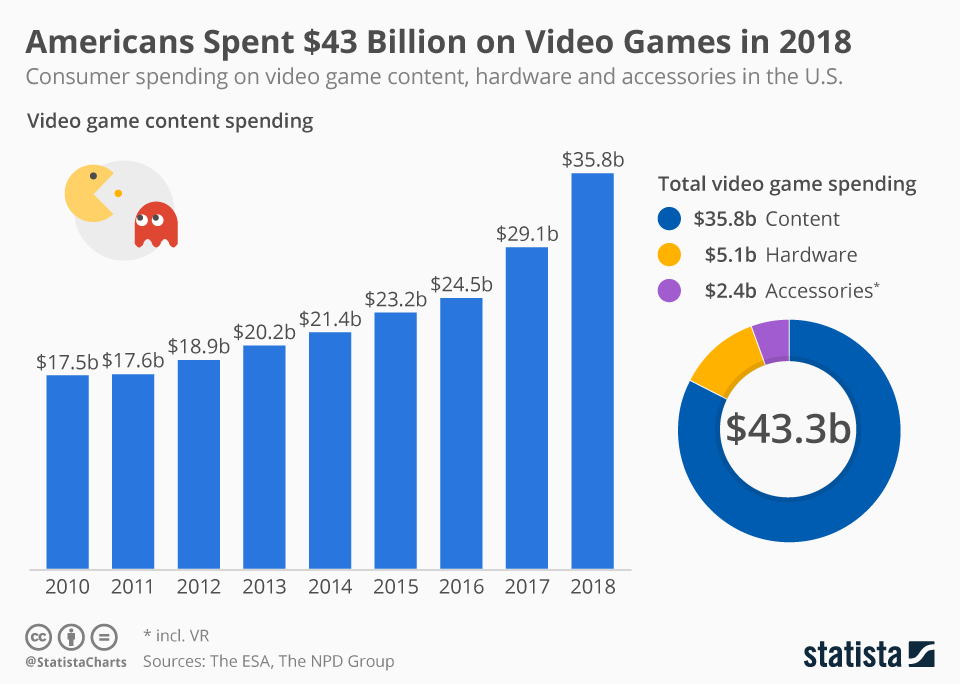
As the following chart illustrates, consumer spending on video games, hardware and accessories reached a record level of $43 billion in the United States last year. Over the next few days, game publishers, console makers and other industry players will do their best to entice gamers to spend even more in 2019.
Related Infographics
FAQ
- The Statista "Chart of the Day", made available under the Creative Commons License CC BY-ND 3.0, may be used and displayed without charge by all commercial and non-commercial websites. Use is, however, only permitted with proper attribution to Statista. When publishing one of these graphics, please include a backlink to the respective infographic URL. More Information
- The Statista "Chart of the Day" currently focuses on two sectors: "Media and Technology", updated daily and featuring the latest statistics from the media, internet, telecommunications and consumer electronics industries; and "Economy and Society", which current data from the United States and around the world relating to economic and political issues as well as sports and entertainment.
- For individual content and infographics in your Corporate Design, please visit our agency website www.statista.design
Any more questions?
Get in touch with us quickly and easily.
We are happy to help!
Do you still have questions?
Feel free to contact us anytime using our contact form or visit our FAQ page.
Your contact to the Infographics Newsroom
Statista Content & Design
Need infographics, animated videos, presentations, data research or social media charts?