Voice-enabled smart speakers have been the latest craze in the consumer tech sector. Ever since Amazon launched the first Echo speaker in 2015, more and more people have jumped aboard the voice assistant hype train and manufacturers such as Google, Apple and Sonos have followed suit.
While talking to an invisible entity in your home certainly feels like the future has finally arrived, what do smart speakers offer once that novelty factor wears off? Which features do people actually use?
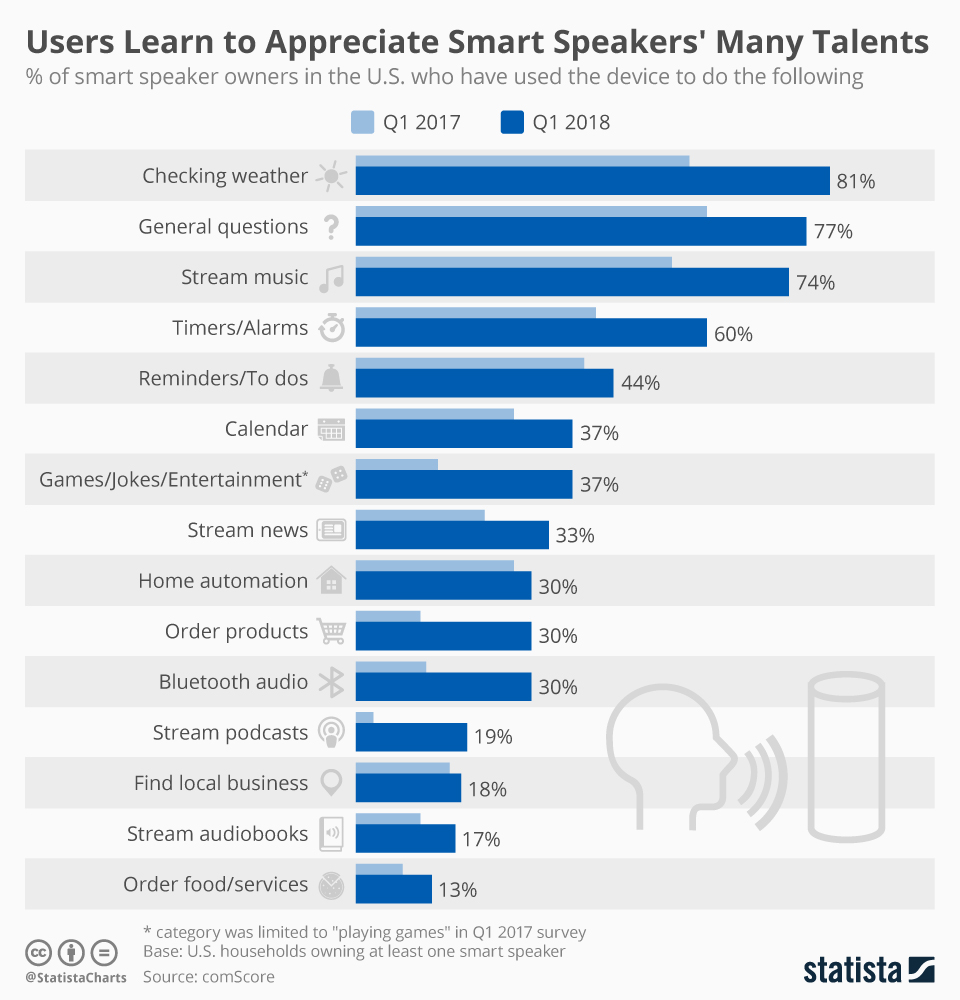
According to research conducted by comScore, checking the weather, asking general questions and streaming music are the most popular use cases for Alexa and her fellow assistants.
As the following chart shows, smart speaker owners are gradually learning to appreciate the many capabilities of their devices or at least they like to experiment with them. comScore survey data from Q1 2017 and 2018 shows that the adoption of all the use cases listed below has increased significantly over the past 12 months.
Users Learn to Appreciate Smart Speakers' Many Talents
Smart speaker use cases

Description
This chart shows what smart speakers are used for by households owning such devices in the United States.


