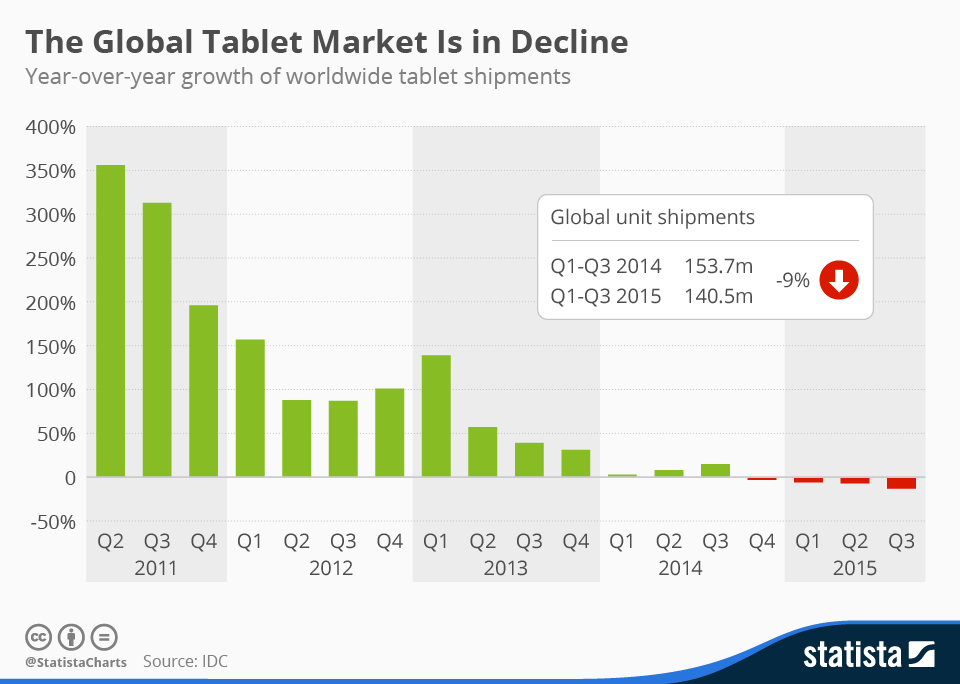
When Apple reported its earnings earlier this week, there was one number that wasn’t in line with the positive overall results: iPad sales declined for the seventh consecutive quarter and reached their lowest level since Q3 2011, when the device was merely one year old.
But it’s not just Apple that is having problems selling tablets, it’s the tablet market overall that is struggling. Global tablet shipments have declined in each of the past four quarters and the negative trend appears to be accelerating.
As smartphones are becoming larger and more powerful, they are crowding tablets out of their own niche. Moreover, as tablets typically aren’t subsidized by carriers the way smartphones are, people tend to upgrade their devices less frequently. This explains why market saturation is setting in much quicker in the tablet market than it did for smartphones.
Related Infographics
FAQ
- The Statista "Chart of the Day", made available under the Creative Commons License CC BY-ND 3.0, may be used and displayed without charge by all commercial and non-commercial websites. Use is, however, only permitted with proper attribution to Statista. When publishing one of these graphics, please include a backlink to the respective infographic URL. More Information
- The Statista "Chart of the Day" currently focuses on two sectors: "Media and Technology", updated daily and featuring the latest statistics from the media, internet, telecommunications and consumer electronics industries; and "Economy and Society", which current data from the United States and around the world relating to economic and political issues as well as sports and entertainment.
- For individual content and infographics in your Corporate Design, please visit our agency website www.statista.design
Any more questions?
Get in touch with us quickly and easily.
We are happy to help!
Do you still have questions?
Feel free to contact us anytime using our contact form or visit our FAQ page.
Your contact to the Infographics Newsroom
Statista Content & Design
Need infographics, animated videos, presentations, data research or social media charts?