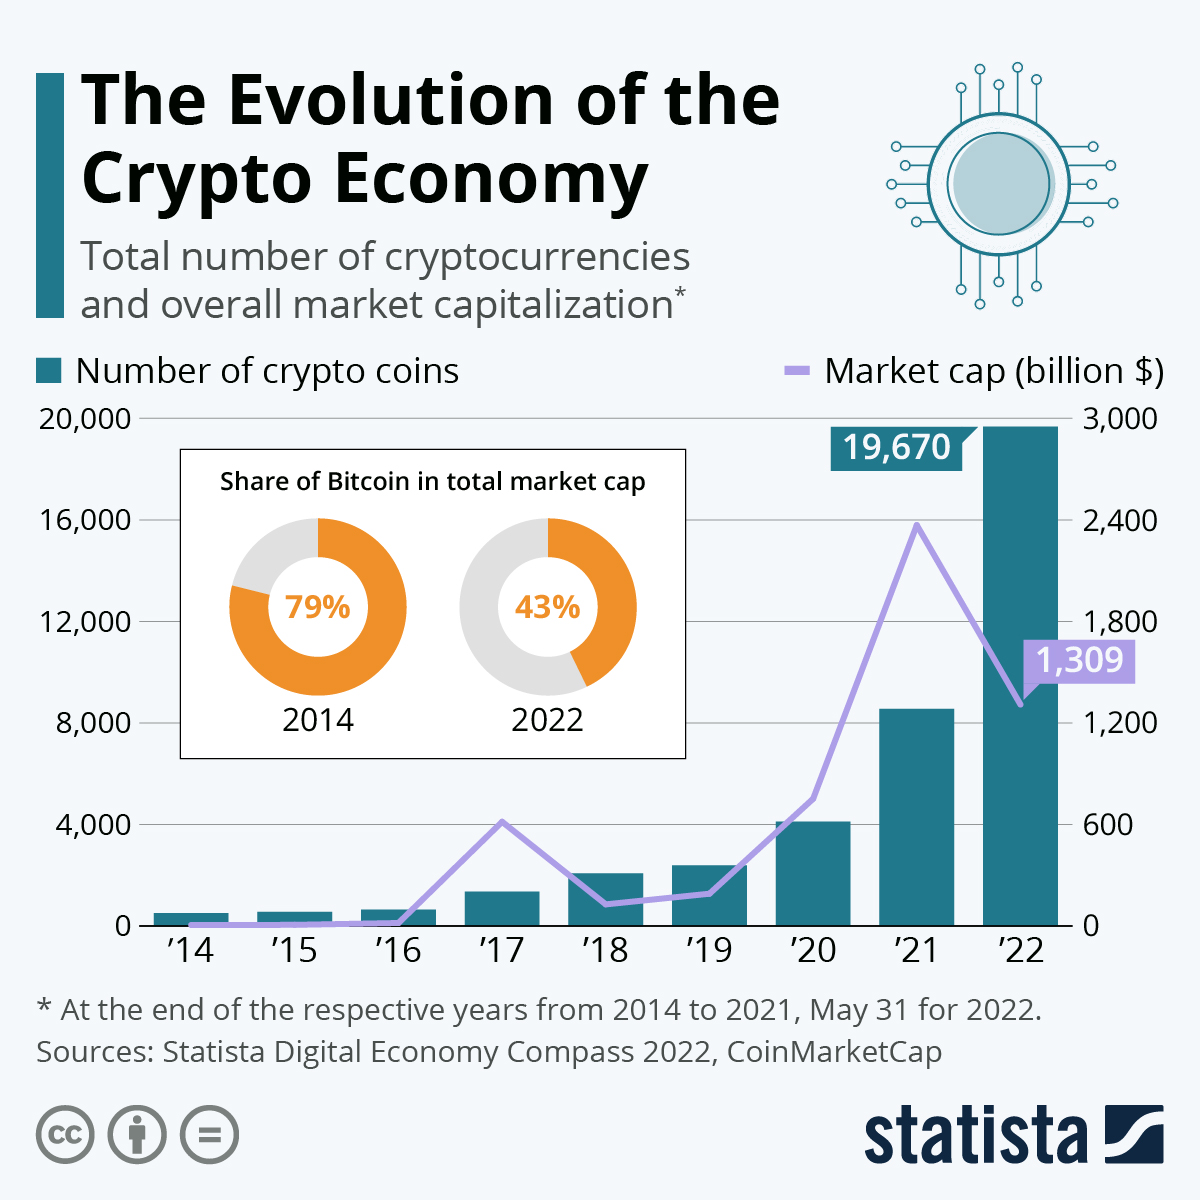
Ever since the birth of Bitcoin back in 2009, the rise of the cryptocurrency market has been marked by turbulence, with both major advances and setbacks. Our infographic takes a look at the evolution of the crypto economy over the past decade, with data from Statista’s Digital Economy Compass study.
Growth has gone through the roof in recent years, rising from only a few hundred virtual currencies at the end of 2014 to nearly 20,000 at the end of May this year. This explosion, particularly seen in the past three years, can be partly attributed to the fact that creating a new cryptocurrency costs nothing and can be carried out in a few clicks. The digital assets listed by our source must, however, meet certain criteria, such as being available on an exchange platform (which helps to exclude fraudulent cases and less serious contenders).
Yet while their number is increasing almost exponentially, the same can’t be said of their value. With an annualized volatility that often amounts to more than 100 percent, cryptocurrencies experience huge fluctuations and remain high-risk investments. After last year's boom and an all-time high of $3 trillion reached in November 2021, market capitalization has collapsed by more than 50 percent and is currently around $1.3 trillion. This figure is still twice as high as the value displayed at the end of 2020.
As our graph also indicates, the importance of Bitcoin, once ultra-dominant in this market, is starting to decline in the face of the rise of other digital assets such as Ethereum. Today, Bitcoin represents between 40 percent and 50 percent of the market capitalization of all cryptocurrencies, compared to around 80 percent in 2014.


