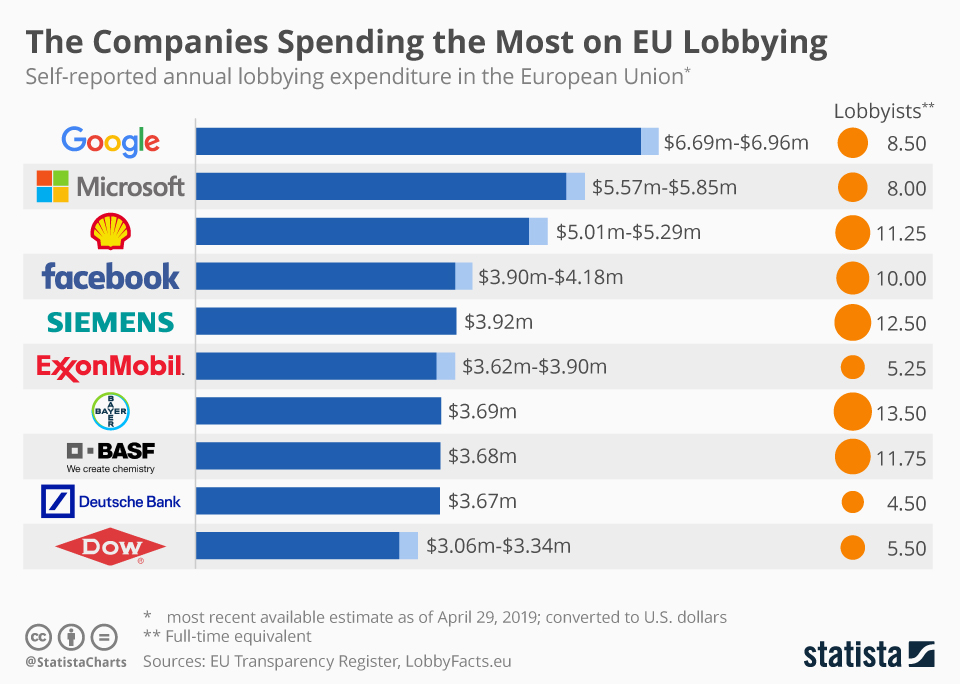
Having been hit with several hefty antitrust fines by the European Commission in the past three years, it doesn’t come as a surprise that Google is trying to improve its relations with the European Union. According to the company’s latest disclosure to the EU Transparency Register, Google spent nearly $7 million on lobbying with EU institutions in 2017, outspending any other company excluding consultancies and law firms lobbying on behalf of third parties.
Since December 2014, Google representatives have had more than 200 meetings with European Commissioners, Members of their Cabinet or Director-Generals, covering a wide range of topics such as copyright, fake news, hate speech and cybersecurity. According to the Register, Google has 15 people on the ground in Brussels, adding up to a full-time equivalent of 8.5.
The following chart shows the biggest EU lobbying spenders based on their latest disclosures.
The Companies Spending the Most on EU Lobbying
Lobbying in the EU

Description
This chart shows self-reported annual lobbying expenditure in the European Union.


