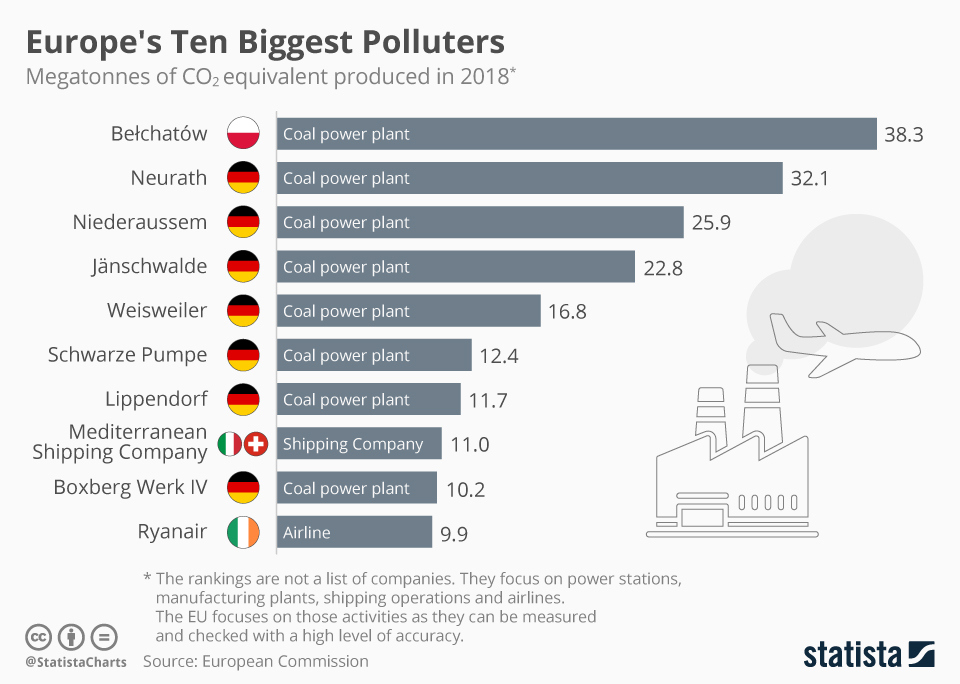
Campaign group Transport & Environment has released new data detailing carbon dioxide emissions across the EU (plus Norway, Iceland & Switzerland) in 2018. Rather than focusing on companies, the data actually takes into account emissions from power stations, manufacturing plants and airlines given that they can be checked with a high level of accuracy.
Historically, the upper echelons of the worst polluters have been dominated by coal-fired power plants and this year, the trend is similar. With 38.3 megatonnes of CO2 equivalent, Poland's Belchatow power station was found to be Europe's biggest emitter in 2018, not too much of a surprise given that it's the world's second-largest fossil fuel power station. What is surprising, however, is the inclusion or Irish airline Ryanair in the top-10 with 9.9 megatonnes.
Earlier this year marked the first time a company not operating a coal-fired power plant has been near the top of the ranking. In response, Ryanair released a statement saying that it was "Europe's greenest and cleanest airline" and that "passengers travelling on Ryanair have the lowest CO2 emissions per kilometre travelled than any other airline". The latest figures also show another company unrelated to coal-fired electricity in the ranking. That is the Swiss/Italian Mediterranean Shipping Company which came in eighth with 11 megatonnes of CO2 equivalent.
Europe's Ten Biggest Polluters
Pollution


