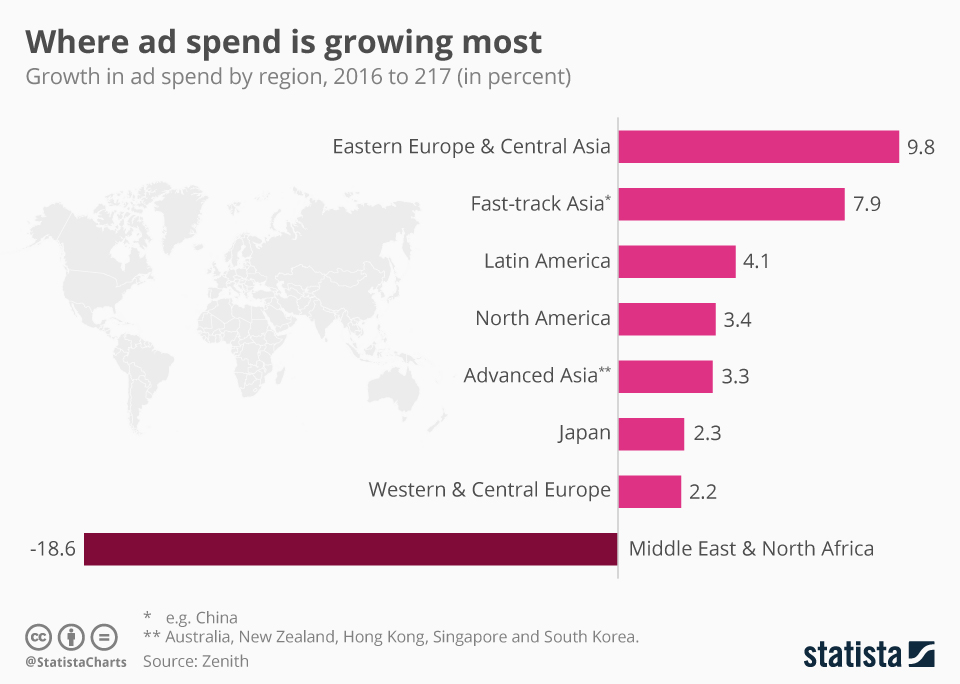
Ad spend can be taken as a yard stick for wider economic and political development and more narrowly speaking, it's an indicator for the media as to what it can expect in terms of ad revenue. Zenith expects worldwide ad expenditure to grow by 4.2 percent in 2017, which would translate in to 559 billion US dollars by the end of the year.
Most growth since 2016 was recorded in Eastern Europe & Central Asia, where spend grew by close to 10 percent, still recovering from a sustained decline since 2014. North America outperformed Western & Central Europe. Zenith argues "political and economic uncertainty in the UK drags down growth." The Middle East & North Africa was the only region where ad spend declined, coming down by 18.6 percent, due to deflating oil prices and political turmoil.
Because markets across geographical blocs have very diverse markets, Zenith has for example broken down Asia into sub-blocs: Fast-Track Asia, countries with rapid adoption of Western technology and practices (such as China), and Advanced Asia (Australia, New Zealand, Hong Kong, Singapore and South Korea.). Japan is its own category.
This chart was first published by our partner website FIPP.
Where Ad Spend Has Most Traction
Ad Spend


