When Sony introduced the Walkman in 1979, it changed the way people listen to music forever. Thanks to the iconic portable cassette player and many copycat devices, people were now able to listen to music on the move, and day-to-day activities such as commuting to work suddenly became a lot less boring.
The Walkman was just one of many examples of technology changing the way people listen to music. The iPod with its huge storage capacity was another one, enabling people to carry the equivalent of hundreds of CDs in their pocket. Right now, technology is once again changing our listening habits and it’s doing so on the hardware and the software side simultaneously. On the hardware side, there is the ubiquity of smartphones that puts a portable music player in virtually everybody’s pocket. On the software side, there’s the rise of streaming services such as Spotify that enable subscribers to access millions of songs on the go.
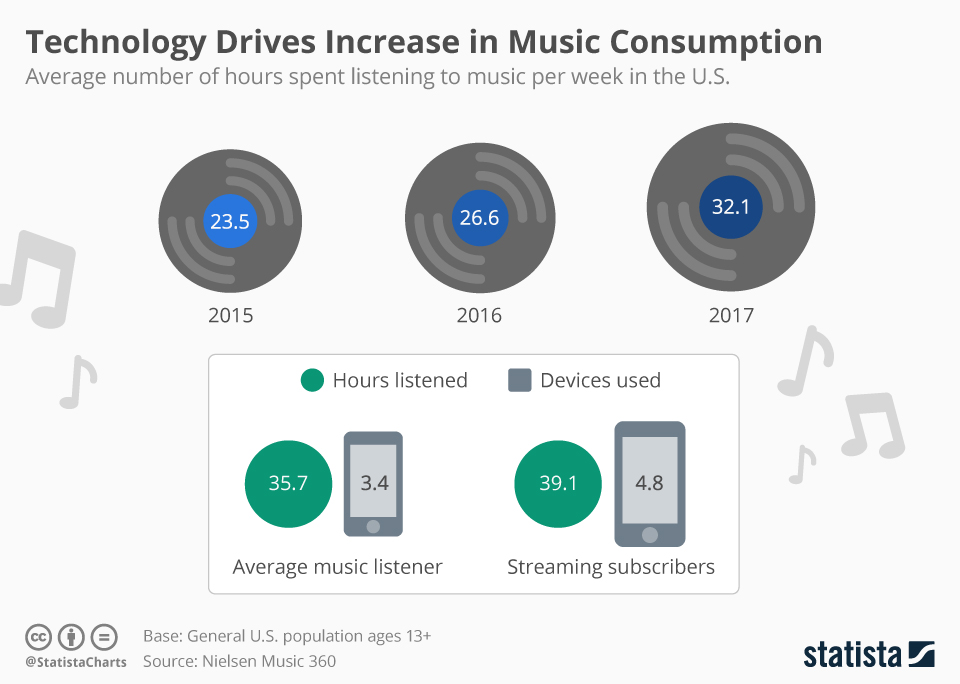
According to figures published in Nielsen’s Music 360 report, Americans spend an average of 32.1 hours a week listening to music. That’s up from 26.6 hours last year and 23.5 hours in 2015. As our chart illustrates, streaming subscribers listen to more music than the average listener (and the average American) and they do so using a handful of different devices.
Technology Drives Increase in Music Consumption
Music consumption


